Why
I'm a big fan of dashboards, metrics, and charts. I'm also a big fan of tracking my procrastination spikes.
In my case, procrastination = more time spent on the internet. So I needed a browser extension to track my history.
There are existing solutions, but they all look kind of boring to me. I really liked how Steam's Year in Review looks. It's exactly what I want - but for a browser.
So I decided to rip off their style and build my own extension.
How
I decided to start small:
- Track visits, not time. Browser tracks only visits anyway. It can be misleading (
google.translateis very misleading: every translation request = new visit), but it works for me for now. - Chrome stores history for only the last 90 days. That's also fine for now.
- I copy pasted their markup for buttons
- I used their vignette effects
- I used their colors
- I used
chart.jsjust like them (I think they usechart.js) - Charts (I think they use `chart.js` - so did I)
I used Sonnet to build prototypes. It helped me iterate quickly.
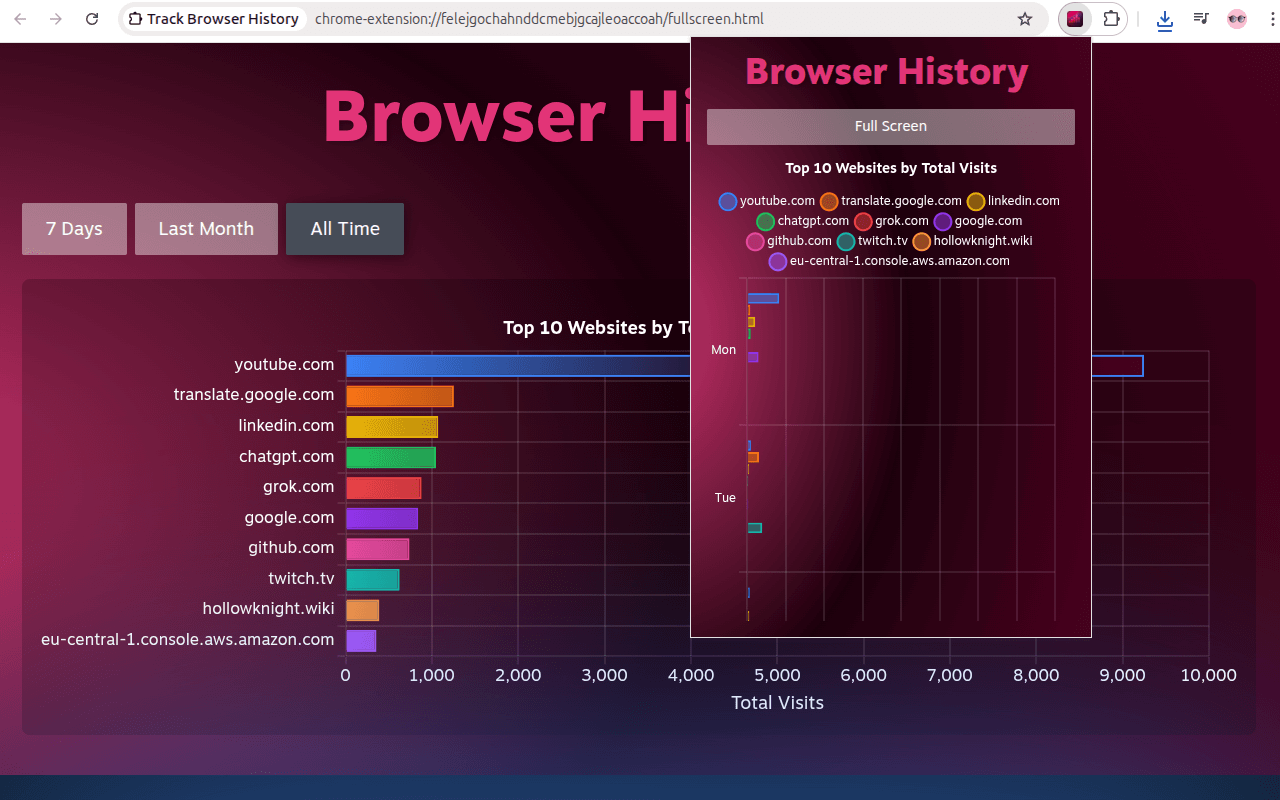
I went through 5-6 iterations before settling on Steam's style:
First draft was buggy, not maintainable in a long run. I fixed critical bugs and made a cleanup.
End result is a chip rip off 🤡, a prototype, but it's useful to me and I really like the direction. I think this is exactly how AI tools should be used: quick iterations to understand if you like the idea or not.
Next
I will (probably) iterate on the implementation:
- Export screenshots of stats
- Cloud uploads
- Time tracking
We'll see.
Link: https://chromewebstore.google.com/detail/track-browser-history/khldlccgjblfkambcpfglnbmogkdkfag